Miguel RiveraBusiness Intelligence Analyst

Case Study 01

Enrollment Trend Analysis

How leadership identified the drivers behind a 9% year-over-year enrollment decline.

Power BIDAXData ModelingSQLExecutive Reporting
Next case study: Space Utilization Analytics
Enrollment overview dashboard

Business Context

The Challenge

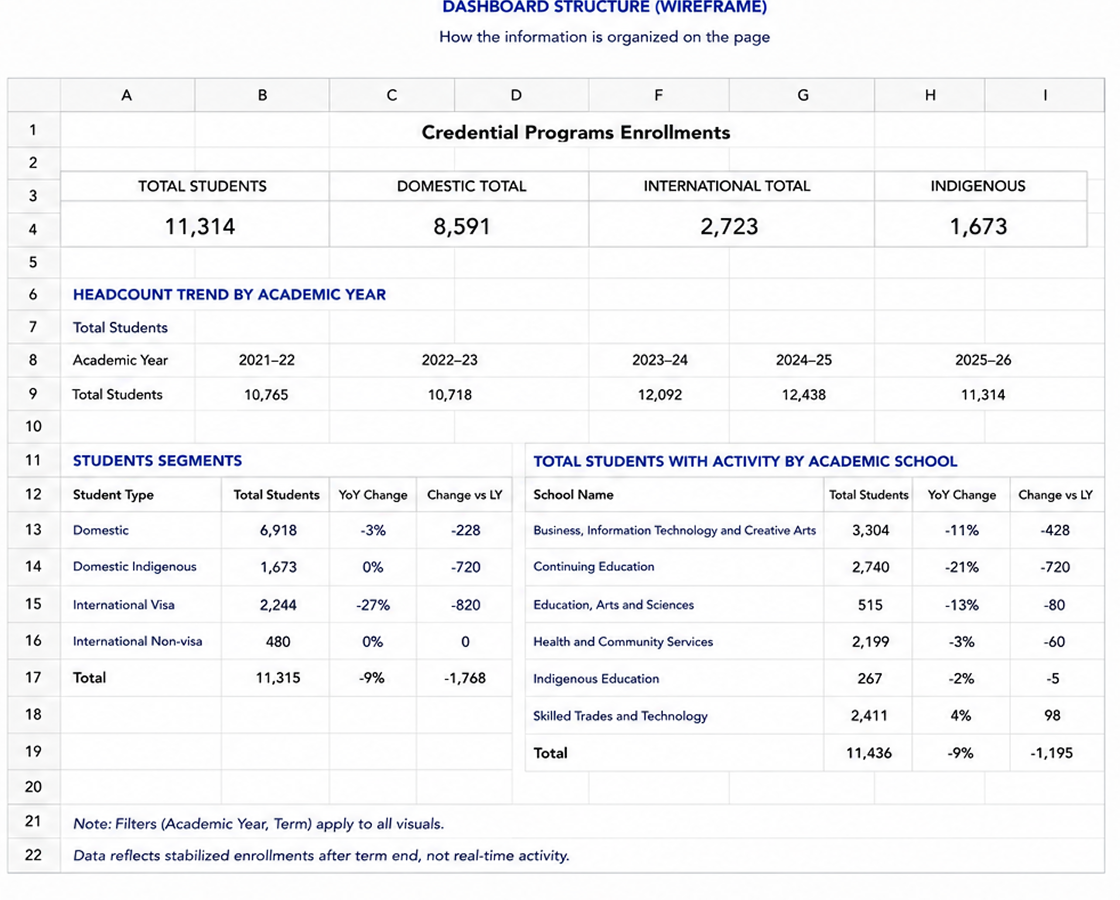
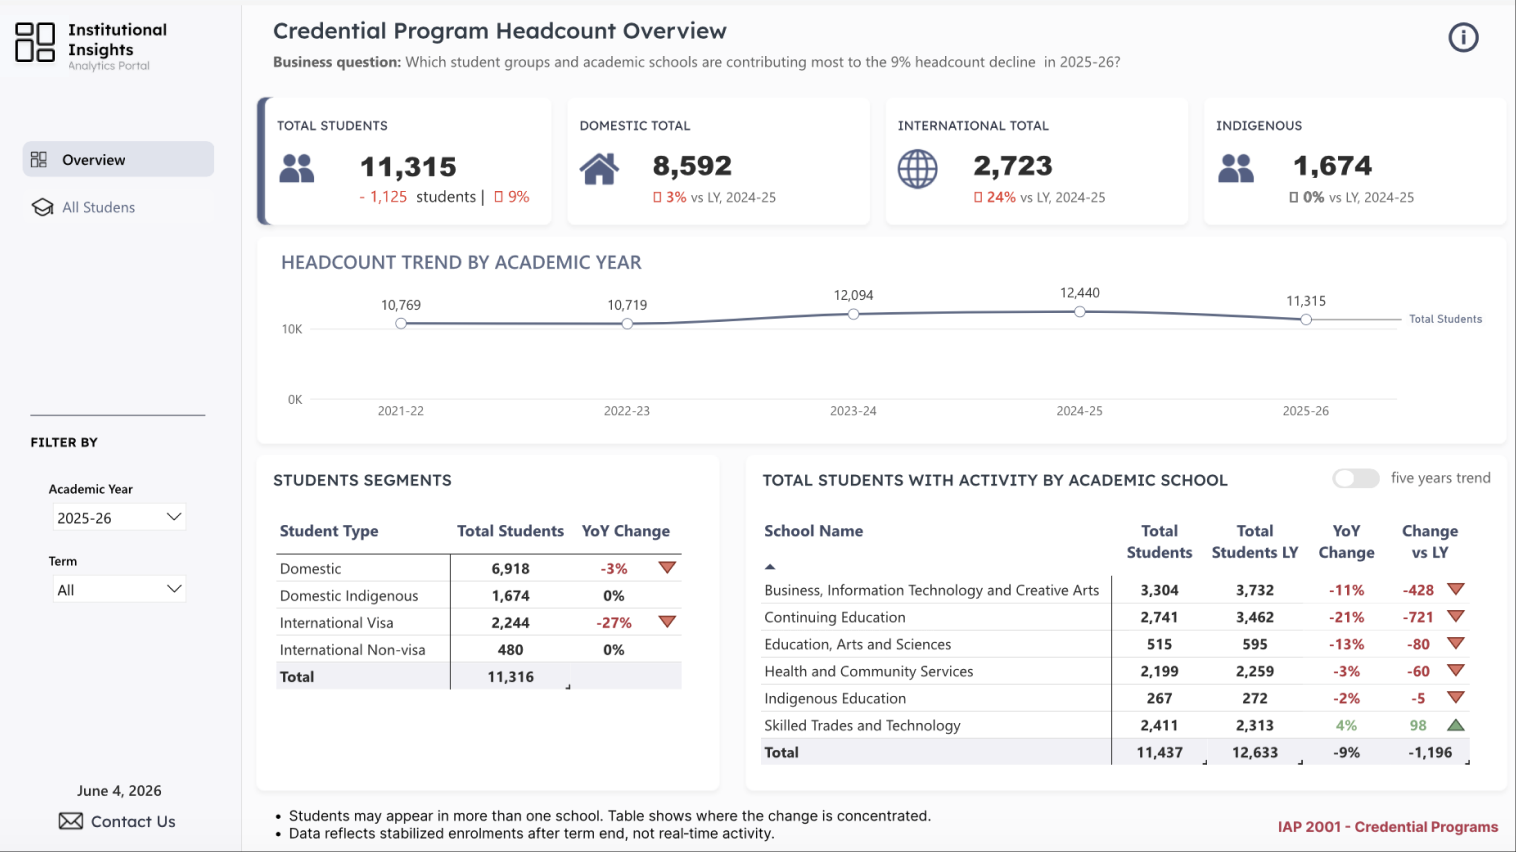
Leadership observed a significant decline in credential-program enrollment but lacked visibility into where the decrease was concentrated.

The objective was to determine whether the decline was broad across the institution or driven by specific student segments, schools, or programs.

Key Questions

What was the overall YoY change in enrollment?

Which student segments were driving the decline?

Which academic schools were most affected?

Where should leadership focus their investigation first?

What I Built

Enrollment overview dashboard
  • Executive KPI summary
  • Year-over-year comparison
  • Student segment analysis
  • Academic school breakdown
  • Program-level drilldown
  • Interactive filtering and slicers

Design Strategy

Dashboard Flow

I translated the leadership question into a dashboard structure that moves from executive signal to diagnostic detail: first the YoY decline, then the student segments, academic schools, and program-level views needed to investigate the drivers.

Analytical Flow

01

Business Question

Which student groups and academic schools are driving the headcount decline?

02

Overall Trend

Confirm the magnitude and direction of the decline over time.

03

Student Segments

Identify which student segments are contributing most to the change.

04

Academic Schools

Pinpoint where losses are concentrated so leaders can prioritize review.

Design Strategy

Design Decisions

01

KPI Cards on Top

Show the key metrics first so leaders understand the overall impact quickly.

02

Trend Line

Make the direction and magnitude of change easy to read over time.

03

Driver Tables

Expose the drivers of decline and show where losses are concentrated.

04

Clean and Scannable

Use consistent colors and directional indicators to support fast decisions.

Key Findings

  • 9% YoY decline in credential-program headcount.

  • International Visa students were the largest student-segment driver of the decline.

  • Continuing Education showed the largest academic-school decline.

Business Impact

  • Identify where to investigate first and prioritize actions.

  • Reduced ambiguity around whether the decline was broad or concentrated.

  • Repeatable view to monitor enrollment movement across years, schools, and student segments.

My Role

Requirements Gathering

Data Modeling

DAX Development

Dashboard UX Design

Stakeholder Validation

Power BI Deployment

Next Case Study

Space Utilization Analytics

How data insights helped optimize classroom utilization and support strategic decision-making.

View case study
Space Utilization Analytics